 Home >
 Knowledge Base >
 FAQs >
 Downloads >
EtherCAT Diagnostics Using the KAS Web Server
Troubleshooting an EtherCAT network in the field is a very difficult task. KAS 2.12 offers EtherCAT diagnostic features to help the machine builders create their machine with a diagnostic tool built in. KAS 2.12 provides two ways to diagnose EtherCAT networks:
- New EtherCAT diagnostic functions and function blocks are introduced to let the application developer customize the diagnostic feature to fit well within their machine architecture.
- An EtherCAT Diagnostic webpage has been added to the PDMM/PCMM web server to help with troubleshooting EtherCAT network problems.
With this feature it is really very simple to identify the cable or the node that is experiencing communication problem.
This article highlights the use of the PDMM/PCMM web server to diagnose the EtherCAT network.
A new "EtherCAT" sub-tab is available in the web server Diagnostics page. This tab displays the EtherCAT topology as shown below.
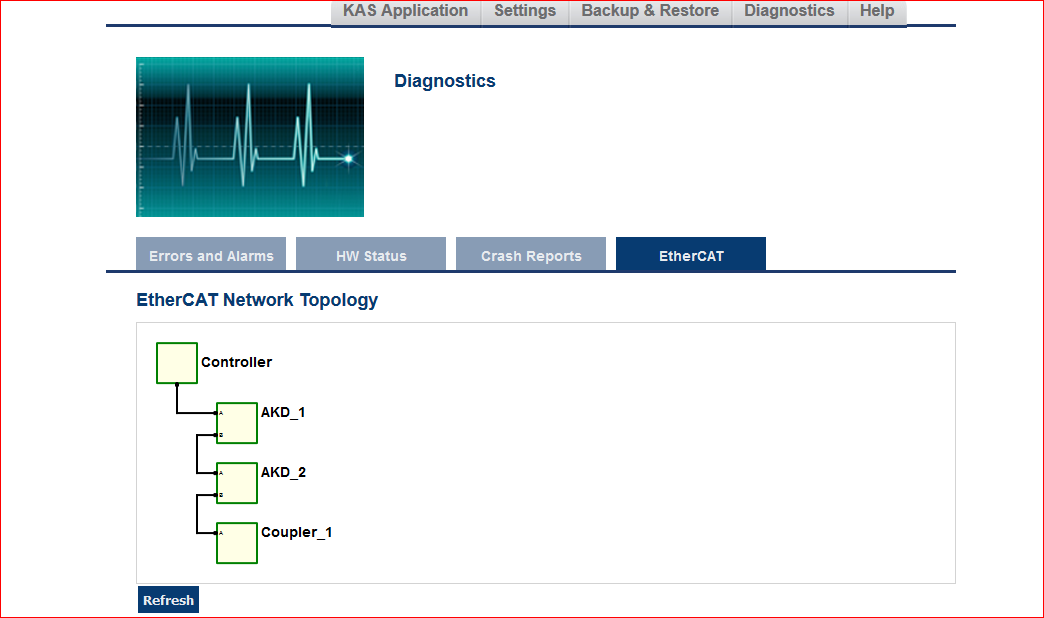
If an EtherCAT error occurs you can press the Refresh button. This will update the display to show the and the latest network state. Any node that is experiencing communication errors will be highlighted in red. Broken links are also highlighted.
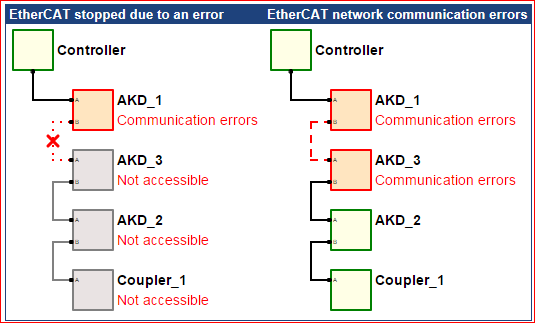
The following screenshot shows examples of two error states: EtherCAT is stopped due to an error, and network communication errors.
Update:
Improvements have been made in KAS 3.2 with the way the diagnostic information is presented.
Now when the user hovers the mouse over the node the diagnostic data will be presented as shown in the p[icture below:
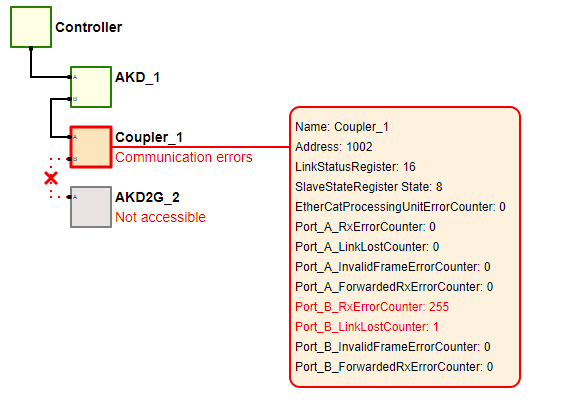
As you can see, the error is shown in Red with the port where the error has occurred.
For customers using KAS release 2.12, 3.0 and 3.1 can also take advantcage of this by using the following steps and use offline viewing of the diagnostic Data.
There are 2 files attached here:
- “offLineEcatDignostics_V2.txt” : This file has all the improved diagnostics logic to display the diagnostics data. After downloading the file rename it to “offLineEcatDignostics_V2.html”
- “ecatDaignosticData.txt” file is the file where the diagnostic data to be stored after getting it from the PDMM. The procedure is described below.
- Copy the above files in the same folder on your computer.
- Procedure to view Offline Diagnostic Data:
- On a browser type in the following command "<ipaddress>/ethercat/diagnosticTopology"; <ipaddress> is the actual Ip address of the PxMM.
- This would trigger the diagnostics in the PxMM and the result will be printed on the browser.
- Select the entire response from the PDMM in the browser and paste it in the “ecatDiagnosticData.txt” file between the “Beginning of Data” and “End of Data” and save the file.
- Now “double click” on the “offLineEcatDignostics_V2.html” to open the diagnostic view.
- Hover the mouse over each node to see the diagnostic state of the node.
- To repeat the experiment, clear the data in the between “ecatDiagnosticData.txt” file between the “Beginning of Data” and “End of Data” and save the file. Repeat steps “a” to “e”
See the KAS Help topics for "EtherCAT Diagnostics" for more information.