Bode plots have existed since the 1930’s when Hendrik Bode devised a way to display gain and phase-shift plots in the frequency domain. Today, to produce a detailed frequency response plot that reveals the unique fingerprint of a servo mechanism in the frequency domain is as simple as pressing a computer key. This paper discusses five key items in a Bode plot and what they reveal about the machine.
A Bode plot is a combination of amplitude and phase response charts related to a servo mechanism subjected to a range of frequencies injected into the system. There is quite a bit of high-level math involved in exactly how the Bode plot is generated but, with today’s powerful microprocessors, the number crunching can be accomplished in a matter of seconds. The measures of amplitude (dB) and phase (degrees) are plotted on a logarithmic scale across the frequency range tested. The graphs show how well the mechanical system responds to a range of frequencies. The changes in amplitude and phase will fit a certain pattern based on the design of the mechanism, and from this pattern, information about the system is revealed.

Figure 1: In a perfect system the amplitude plot will have a straight negative slope at -20dB/ decade. The phase should start at -90° and drop at a negative slope from the point the amplitude crosses zero dB.
At very low frequencies, a mechanical system follows the injected signal, and remains in phase with the frequency or amplitude. As the frequency increases, the mechanical response amplitude will decrease, while the phase begins to lag. This can be demonstrated by holding an elastic band looped through several washers that are hanging down. As you move the rubber band slowly up and down, the washers will follow the movement closely. As you move the band faster and faster, the frequency increases, and the washers cannot keep up due to the compliance in the elastic band. At various speeds, the washers will stop moving altogether, move wildly out of control, or even move opposite to the direction of the desired motion.
Bandwidth
Bandwidth is directly related to the settling time of the mechanism. The higher the bandwidth, the faster the time to settle to a commanded speed or position. The bandwidth of a mechanism relates directly to the productivity of the system. In the open loop Bode plot, bandwidth is determined at the frequency the amplitude plot crosses zero dB.

Figure 2: The system bandwidth is the point the open loop plot crosses 0dB in the Amplitude plot.
Stability
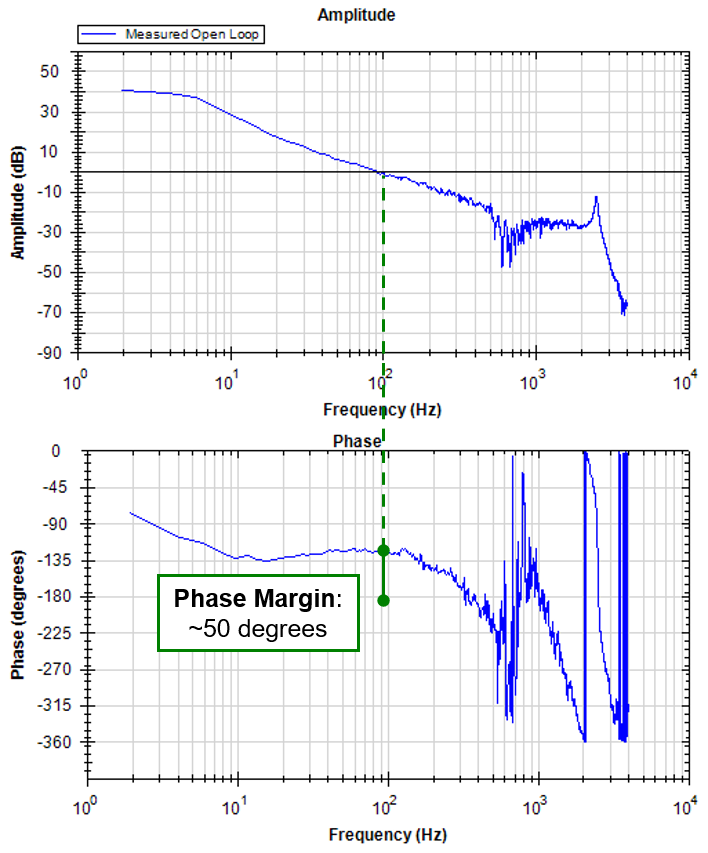
The stability of a system relates to how well the system behaves during all aspects of operation. A servo mechanism is considered stable if the system operates smoothly and never goes erratic during motion or at rest. Phase and gain margins are particularly good indicators of system stability and can be derived from the open loop plot as well. The larger the margins, the more stable the system. Specifically, the gain margin is the value of the amplitude plot below 0 dB (measured in dB) when the phase first reaches -180 degrees. The phase margin is the difference between the phase value and -180 degrees at the point the amplitude value crosses 0 dB. Understanding the stability of a system provides a clear indication if it will perform smoothly and reliably in all conditions.

Figure 3: Phase and Gain Margin measurements indicating relative stability
Anti-resonances and Resonances
Key elements of any system are the various resonant frequencies associated with any mechanical compliance throughout the system. Each mechanical element of a system will have its own natural resonance frequency (the bode plot reveals each one) showing both an anti-resonance and a resonance point - where the mechanical element decouples from the system (anti-resonant node) or is excited at its resonance point (resonant node). Each pair of nodes relates to a compliant element in the system. While a system may have several resonant nodes, the first set of nodes (lowest frequency) is the most critical, since a bandwidth higher than the first anti-resonant node frequency cannot be achieved. The resonant points provide clues as to how the system can be optimized through system tuning.

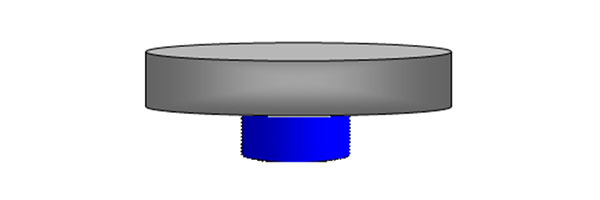
Figure 4: Tying the mechanical set up to what is revealed in the bode Plot
Stiffness and Load to motor inertia
Another interesting reveal of the bode plot is the load to inertia ratio magnitude. In a simple two body system, the width (difference in frequency) of the first anti-resonant node to the first resonant node is proportional to the inertia ratio – the greater the difference, the greater the load to motor inertia ratio. The stiffness and load to motor inertia relationship is critical in understanding system performance.

The wider the gap between the anti-resonance and resonance frequencies, the higher the inertial mis-match
The higher the frequency of the first anti resonant node, the stiffer the mechanism. The following equation helps identify the first anti-resonant node:

Where K is the stiffness of the system, and JM the inertia of the motor
The resonance of the system is calculated as:

Where K is the stiffness of the system, JM the inertia of the motor, and JL the load inertia
Tuning plan of attack
The previous points provide key information to tune the system for optimized performance. A variety of filtering techniques can be applied, including lead-lag, notch, or bi-quad filters, to improve the response of the system. By applying a combination of filters, the amplitude and phase values can be changed to improve phase and gain margins, improve bandwidth, or eliminate potential resonance issues. Understanding the overall plot results leads to knowledgeable filtering decisions to tune the system.
Conclusion
The Bode plot is a vital tool in helping diagnose and tune a system to optimize servo performance. Once a system is tuned for best performance, the captured Bode plot can be used as a baseline “golden plot” to compare with for preventative or predictive maintenance. When compared to the golden plot, a loose coupling or timing belt will be indicated as an anomaly and can be corrected before damage occurs. While this paper touched on only a few of the items disclosed by the plot, more advanced Bode tools exist that can further enhance the understanding of the entire machine structure and quickly denote areas that should be addressed.